Carbohydrate, Protein, and Photosynthesis Levels Show Inconclusive Results on Maintaining Rosa multiflora Healthhttp://www.msu.edu/~jaekelja/roseexperiment.html 3 Girls and a Guy By: C. Harvey, J. Jaekel, S. Momola, A. Schuiteman LBS 145 Friday Lab Susannah Coopers
|
Click on links to go to heading |
ABSTRACTWritten by C. Harvey The rose, Rosa multiflora, requires many different nutrients, such as sugar, to survive. Once cut, it slowly begins dying from lack of nutrients. In order to lengthen the vase life of the rose, these nutrients must be put in the vase water to replenish the flower. This can be done by adding different substances, such as aspirin, 7-UP, and floral food. During the experiment, roses were separated into four different vases containing water. Aspirin, 7-Up, and floral food were added separately to 3 of these vases. The effects on the roses were tested to determine the overall ‘healthiest’ solution, with an extended vase life. Healthiness was evaluated visually and quantitatively through photosynthesis, carbohydrate, and pH tests. The healthiest rose was considered to have high photosynthesis, red in color, and not wilting. The carbohydrates were tested using the Barfoed, Bial, Iodine, and Selivanoff test, which was also quantified. The protein was quantified using the Bradford test; photosynthesis was tested with the absorption spectrum; and the pH was found using pH strips. It was found that the 7-Up rose had the highest sugar concentration, followed by the water, floral food, and aspirin. The protein concentration was greatest in the 7-Up rose, followed by the floral food, water, and aspirin. Absorption was greatest for the floral food rose, followed by water, arpirin, and 7-Up. According to the healthiness scale the 7-Up rose appeared healthiest followed by water, floral food, and aspirin. INTRODUCTIONWritten by C. Harvey The Rosa multiflora is like most flowers, in that it requires many nutrients, such as sugars, to stay alive. Once the R . multiflora is taken from its natural environment, through the process of cutting, it slowly begins to die due to a lack of nutrients. Without any root system to replenish it, the R .multiflora simply uses what little nutrients are left until they are gone, then the rose wilts. (Meyer, 1998) Many florists have developed different home remedies to keep roses looking healthier and beautiful. These methods include putting aspirin in the water, putting 7-Up in water, fertilizer in water, etc. All of these treatments are known to work; however, it is unknown which remedy works the best. Once a flower is cut, it sends out a hormone that causes jasmonic acid to be secreted by the plant. The jasmonic acid helps fight off predators; however, it also causes the plant tissues to age much faster than normal (Pompodakis, 2003). Therefore, in order to prevent the aging of the R . multiflora, something is needed in order to inhibit the production of jasmonic acid. This is a main reason for the use of aspirin. Aspirin contains ingredients that slow jasmonic acid production, therefore minimizing the aging process. However, aspirin does not contain any food or sugars for the flower. Therefore, once all the nutrients inside of the R . multiflora is used, the flower will begin to wilt. (Anonymous-3, Unknown) To give the flower nutrients, many florists have tried using 7-UP mixed with water. The sugar contained in the 7-UP helps maintain the flower’s health and beauty. The 7-UP also contains acid, which helps neutralize the water and creates a more suitable environment for the R. multiflora (Behe, 2002). The soda, however, does not contain items that inhibit the production of jasmonic acid, allowing jasmonic acid to be produced at a normal rate and aging could still occur. According to a recent study on the sugar content in roses, roses in solutions containing 1-2% sucrose caused dark patches on the leaves within 24 hours of vase life, causing the leaves to be crisp and somewhat dry. Therefore, the 7-UP solution would have to contain lower amounts of sucrose sugar, to work effectively on the preservation of the R. multiflora (Pompodakis, 2003). Many florists have found a way in which the R. multiflora can obtain nutrients and fight off bacteria by developing a floral food that contains numerous items. The floral food, on average, contains sucrose, an acidifier, an inhibitor of microorganisms, and a respiratory inhibitor, which inhibits growth of bacteria and maximizes water uptake (Anonymous-1, 2001). The sucrose and acidifier will cause the same effects as the 7-Up while increasing the water uptake, due to a respiratory inhibitor, should increase photosynthesis and the vase life of the rose. We examined the effects of four treatments on R. multiflora. Treatments of: water, 1% aspirin solution, 50% 7-up solution and a packet of floral food. Before placing the rose into the designated liquids, it was cut at a diagonal, underwater, to prevent air from entering the stem and blocking the supply of nutrients. The different water solutions were also tested for carbohydrates, pH, and protein. Barfoed’s, Bial’s, Selivanoff, and Iodine were used to tests for carbohydrates, and Bradford’s Assay for the protein. The petals and leaves were also tested for proteins and sugars along with photosynthesis. Photosynthesis was tested using the absorption spectrum. After a week of vase life, the roses were tested for amounts of carbohydrates, pH, and photosynthesis, to determine the healthiest rose. A health scale, level 5-1, was set up prior to the experiment (See Methods section). Our hypothesis was that the floral food will be the most effective at keeping the flower healthy and attractive. The floral food contains nutrients, an acidifier to neutralize the acid, and a respiratory inhibitor, which inhibits growth of bacteria and maximizes water uptake. If water uptake is maximized, then photosynthesis will also be high, therefore producing a healthy R. multiflora. Methods Written by S. Momola Materials: Twelve fresh red roses, Meijer brand 500mg aspirin tablets, and a bottle of 7-up was purchased at Meijer, 2055 West Grand River Rd., Okemos, Mi. Three roses were placed in four separate vases. Vase one was filled with 500mL of only distilled water, which served as the control in the experiment. Vase two was filled with 500mL of distilled water and 325mg of crushed aspirin. Vase three consisted of 500mL of distilled water and 1.25g of floral food that came with the roses. Vase four held 250mL of 7-up and 250mL of distilled water. Healthiness: The four vases consisting of the solutions and roses were stored at room temperature (22° C) for seven days. After day two, day four, and day six, the solutions were changed. On day four, the petals and leaves were removed from one rose in each solution and stored in a freezer in zip-block bags making sure that the different rose petals and leaves from different solutions stayed separated. This was repeated on day six. On days two, four, and six each rose was rated using a health scale with was determined prior to the experiment. (Table 1) Carbohydrates: The presence of carbohydrates was tested on both the petals and leaves of the rose. All of the petals from the rose that were removed from a rose on days four and six were taken from the freezer and weighed separately per solution. 2g of petals were placed in a blender and 100mL of water was added. This mixture was then ground up in the blender for approximately two minutes, or until most of the particles were blended. This mixture was then poured from the blender through four layers of cheesecloth into a 250mL beaker. The blended solution was then poured into a tube and capped. The petal extract in the tube was then centrifuged at 2000rpm in a clinical centrifuge for three minutes. This process was then repeated using the leaves from day four and day six. However, only .3g of leaves was collected. Barfoed’s test was then applied by placing 3mL of Barfoed’s solution into six separate test tubes which contained 500μL of a particular petal extract. The control test tubes consisted of either 500μL of water or glucose. After the tubes were prepared, they were placed in a hot water bath (100°C) for two minutes. Color changes that occurred in the tubes were recorded. The same procedure was done for the leaf extract. (Krha 2005) Barfoed’s test was repeated a total of four times on both the petal and leaf extracts. Selivanoff’s test was performed by adding 350μL of a particular petal extract into the properly taped test tube. Two of the six test tubes separately contained 350μL of water or glucose which served as a control. 3mL of Selivanoff’s reagent was added to each test tube. The tubes were then placed in a hot water bath (100°C) for approximately one minute. Observations were then recorded immediately. The same procedure was used for the leaf extract. Selivanoff’s test was replicated a total of four times. (Krha 2005) In the independent Selivanoff’s test, the amount of sugar in the rose’s petals and leaves was quantified. Before quantifying the petal and leaf extract, a standard curve was created. To create the standard curve, a pipette was used to aliquot a 1% fructose solution into different concentrations of fructose and water into test tubes; 350μL fructose/ 0μL distilled water, 300μL fructose/ 50μL distilled water, 250μL fructose/ 100μL distilled water, 200μL fructose/ 150μL distilled water, 150μL fructose/ 200μL distilled water, 100μL fructose/ 250μL distilled water, 50μL fructose/ 300μL distilled water, 0μL fructose/ 350μL distilled water. After all concentrations were made, Selivanoff’s test was run on each test tube. In each of the eight test tubes, which contained the fructose and distilled water concentrations, 3mL of Selivanoff’s reagent was added. These tubes were then placed in a hot water bath (100°C) for one minute. After one minute the test tubes were then placed in a centrifuge for three minutes at 4000rpms. After the concentrations had been centrifuged for three minutes, 300μL of each concentration was placed into separate cuvettes. After the 300μL was placed in the cuvettes, 3mL of distilled water was also added. One of the samples was then placed in the spectrophotometer and ran through wavelengths ranging from 300-600nm. The ideal wavelength for absorbency was determined to be 520nm. After the ideal wavelength was determined, all seven of the cuvettes containing the concentrations were run through the spectrophotometer. Observations were recorded to create a standard curve. After determining the standard curve, the same procedure was used on the petal extracts. 300μL of each petal extract was placed in a test tube along with 3mL of distilled water. The tubes were then placed in a hot water bath (100°C) for one minute. The test tubes were then placed in a centrifuge for three minutes at 4000rpm. The concentration that had been centrifuged was then placed into a cuvette. The absorbency of the petal extract was then recorded for each solution at 520nm using the spectrophotometer. Observations were recorded. The same procedure was then used to find the absorbency of the leaf extracts. Bial’s test was then performed. 350μL of a particular petal extract was added to the properly labeled test tube. 350μL of water or fructose was also added to two separate test tubes which served as a control. Then 3mL of Bial’s reagent was added to each of the six test tubes. All tubes were placed in a hot water bath (100°C) for five minutes. Observations were then recorded. The same procedure was used to test the leaf extract. (Krha 2005) Bial’s test was replicated a total of four times. The iodine test was performed. 350μL of petal extract was placed in the proper test tube indicated by tape. 350μL of water and glucose were also placed in the proper tubes and served as the control. 35μL of IKI reagent was then added to each tube. The tubes were kept at room temperature (22°C) and observations were recorded. (Krha 2005) The same process was done using leaf extract. The iodine test was replicated four times. Proteins: The Bradford Assay was used to determine the protein concentrations of our petal and leaf extract. When testing the protein in our solutions we used the Bradford Assay. Before testing the protein concentrations in our petal and leaf extracts, we constructed a standard cure using bovine serum albumin (BSA) and Bradford reagent. To make the standard curve, 5μL of BSA was placed in a clean glass cuvette and 45μL of distilled water was added. This mixture was then vortexed and left to sit for five minutes. After five minutes, 3mL of Bradford’s reagent was added to the same cuvette and vortexed again. The solution stood for five minutes before being placed in the spectrophotometer. At 595 nm absorbance, the machine was blanked with distilled water which was in a cuvette. After blanking, the cuvette consisting of the solution was placed in the spectrophotometer and the amount of absorbance was recorded. This procedure was then repeated changing the measurements to 10μL BSA/ 40μL distilled water, 15μL BSA/ 35μL distilled water, 20μL BSA/ 30μL distilled water, 25μL BSA/ 25μL distilled water, 30μL BSA/20μL distilled water, 35μL BSA/ 15μL distilled water, 40μL BSA/ 40μL distilled water, 45μL BSA/ 5μL distilled water, and 50μL BSA. After obtaining a standard curve, we prepared each petal extract solution the same ways as we prepared the BSA and Bradford reagent. This time 5μL of petal extract was placed in a clean glass cuvette and 45μL of distilled water was added. When the solution was less than 50μL, distilled water was added to bring the volume to 50μL. The solution was then vortexed and left to sit for five minutes. After five minutes, 3mL of Bradford’s reagent was added to the same cuvette and vortexed again. The solution sat for another five minutes before being placed in the spectrophotometer. With the spectrophotometer at 595nm absorbance, the machine was blanked with distilled water in a cuvette before placing the petal extract in the spectrophotometer and recording its absorbency. The petal extract solution was only prepared and read at the following dilutions: 45μL extract/ 5μL distilled water, 25μL extract/ 25μL of distilled water, and 5μL extract/ 45μL distilled water. Observations were then recorded of the petal extract absorbency. The same procedure was used to read the protein concentrations in the leaf extract. (Krha 2005) One trial was performed on each of the eight sample solutions. Photosynthesis: For the absorption spectrum, phosphate buffer, the blender attachment, and indophenol were chilled. The petals of one rose in each of the solutions were removed and weighed so that each sample’s leaves were 2g. The petals from a particular rose were placed in the chilled blender attachment along with 100mL of phosphate buffer. The blender was then with parafilm and pulse spun until the solution was completely homogeneous. The homogeneous mixture was then filtered through four layers of cheesecake into a 250mL beaker. After the mixture was filtered in the beaker, the contents were poured into a test tube, accumulating to 10mL, capped, and was immediately placed on ice. A total of four tubes were made, and then centrifuged for five minutes at 5000rpm and returned to ice. 5mL of the mixture was then placed into a separate cuvette for each mixture. The spectrometer was then set to 445nm and blanked with a cuvette consisting of 5mL of phosphate buffer. If a sample’s reading happened to be less than 10%, phosphate buffer was used to dilute the solution. Each sample’s level of transmittance was measured and recorded by using the spectrometer measuring levels from 400nm to 700nm in 15nm intervals. Between switching the cuvette tubes at each wavelength, the spectrometer was zeroed by using a polyphosphate buffer. The same process was used to measure the transmittance of the leaf extract. The absorption spectrum was done once on the rose petals and leaves from day four and day six. pH: During week three, a pH test was performed on the vase solutions, and the petal and leaf extract. A piece of pH paper, approximately 2in in length was dipped in each of the solutions. The color on the strip of pH paper was then compared to the pH color scale. Observations were recorded.
Results Written by S. Momola A healthiness scale was created prior to the start of our experiment in order to rate the healthiness of a rose in a particular solution according to the rose’s appearance. (Table 1) According to our healthiness scale, the rose in the 7-up solution had the healthiest looking appearance, followed by the control of water, floral packet, and lastly, the rose in the aspirin. (Figure 1) When doing the carbohydrate analysis, Barfoed’s, Selivanoff’s, Bial’s, and the Iodine tests were completed on both the petal and leaf extracts from roses in solutions of aspirin, 7-up, floral food, and water. Barfoed’s test showed no reaction on any of the leaf extract solutions indicating a presence of disaccharides or polysaccharides in the rose leaves. (Figure 2) However, Barfoed’s test indicated a presence of monosaccharide in the petal extracts. (Figure 3) During Barfoed’s test on the petal extract the solutions turned a turquoise color and there was an accumulation of a precipitate. (Figure 3) Selivanoff’s test on the leaf extract showed no reaction occurring immediately on the aspirin, floral food, and water solutions. (Figure 4) This indicated a presence of an aldose in the rose’s leaves. The leaves in the 7-up solution had a slight color change from clear to a light peach color, indicating a ketose. (Figure 4) When the petal extracts underwent Selivanoff’s test the aspirin, 7-up, floral food, and water solutions had an immediate reaction that occurred turning the solutions to a deep red color. (Figure 5) This indicated the presence of a ketose. As part of our independent lab, we quantified Selivanoff’s test. In the quantitative Selivanoff’s test, we were looking for which solution of leaf extract or petal extract consisted of the highest amount of carbohydrate. It was found that from the leaf extract the water leaves had the highest amount of carbohydrate, followed by the leaves from the roses in the 7-up, floral food, and aspirin solutions. (Figure 6) It was also determined that the petal extract of the 7-up had the highest amount of carbohydrate followed by the rose petals in solutions of water, floral food, and aspirin. (Figure 7) The Bial’s test on the leaf extract had no effect; the colors of all the solutions stayed the same. (Figure 8) The Bial’s test performed on the petals extract showed a color change in all of the solutions with the 7-up solution having the darkest color change. (Figure 9) Each solution changed to a bright red, deep red or orange color. (Figure 9) This color change indicates the presence of furanoses. The Iodine test on the leaf extract showed the solutions to all be a constant yellow color, testing negative for the presence of starch. (Figure 10) The Idoine test on the petals caused the solutions to become a red color, but still indicated a lack of starch. (Figure 11) The Bradford Assay was completed to show concentrations of proteins found the in extracts of a rose’s leaves and petals. The Bradford Assay showed the rose leaves from the floral food to have the highest level of protein followed by the leaf extracts from the 7-up, aspirin, and water. (Table 2) The Bradford Assay also showed the rose petals in the 7-up solution to have the highest amount of protein when compared to the other rose petal extracts followed by the floral food, water, and aspirin petals. (Table 2) The Absorption Spectrum was completed to show the amount of absorption occurring the in the extracts of a rose’s leaves and petals. The rose leaves of the floral food show the highest level of absorption, followed by the water, aspirin, and 7-up leaves. (Figure 12) The rose petals from the water extract was found to have the highest absorbency followed by the petal extract from the aspirin, 7-up, and the floral packet. (Figure 13) For our independent lab a pH test was completed. The pH test was completed to determine if the solutions of the rose’s vase along with the rose leaf and petal extracts were acidic or basic. All vase solutions and petal and leaf extracts had a pH of approximately five except for the aspirin leaf extract and the water leaf extract solutions. (Figure 14) The aspirin leaf extract and water leaf extract had a pH of about seven. (Figure 14) This shows that most of the vase solutions and rose extracts have a basic to neutral environment. Discussion Written by A. Schuiteman After performing experiments on the carbohydrate, protein, and the amount of pigments absorbed, it was found that the roses that contain high amounts of sugars produce a healthier appearance in the rose, whereas the rose that had a higher pigment absorption was not as attractive in appearance. Therefore, it is supported that sugar presence is correlated with the overall appearance of the rose, possibly acting as a preservative for the rose petals. The roses in the 7-Up solution produced roses with the best appearance according to the healthiness scale, however, according to our data, the roses in the floral food were experimentally the healthiest, determined by a higher absorption rate. The roses exposed to the 7-UP solution had a prolonged life span compared to the roses in the other vase solutions. The roses that were in the 7-Up solution were overall healthiest, according to our healthiness scale, in comparison to the other three vase solutions. The roses in the 7-Up solution consisted mostly of sucrose. Sucrose is the main sugar that is found in 7-Up; therefore this was the main energy source for the roses contained in this solution. The sucrose provided the rose plant with a source of energy, which allowed the rose to produce more energy and food (Bene, 2002). Sucrose in the solution also acted as an acidifier, which inhibited the entry of microorganisms into the stems of the roses (Bene, 2002). Not only did the 7-UP consist of sucrose, it also contains citric acid and sodium citrate, which is an additional acidifier, thereby inhibiting more microorganisms to come into the stems of the roses.(Anonymous-6, Unknown) The floral food solution produced the next healthiest rose. The rose in the floral food was affected by the nutritional and bacterial protection provided by the floral food’s ingredients (Perry, 2004). Like the rose contained in the 7-UP solution, the roses in floral food solution consisted of sucrose. Sucrose in the solution acted as an acidifier, which inhibited the entry of microorganisms into the stems of the roses. The sucrose also provided the rose with a source of energy (Meyer, 1998). Roses in the other solutions and water did not survive as long, due to a lack of either nutritional and/or bacterial protection. Roses that were kept in the aspirin solution had the third longest life span. The aspirin in the solution provides the rose with an antibacterial agent similar to those found in the floral food and 7-UP solutions (O’Donnell, unknown). The rose contains an agent called jasmonic acid. Once cut, the plant releases jasmonic acid, which slowly causes the plant to die. The aspirin solution contains an antibacterial agent that stops the production of jasmonic acid produced by the cut stem of the rose (O’Donnell, unknown). Finally, the roses in the control of water had the shortest life span out of all treatments. The water will provide no additional nutritional value to the plant and will not protect the plant from bacteria. Petals are a unique function in the life of plants. Petals are bright in appearance and serve to attract different pollinators to the flowers, resulting in a higher production of offspring. It requires a numerous amount of energy to produce this offspring, and many different nutrients. It requires a high amount of protein and starch to produce a seed and provide the nutrients that the seed needs to develop inside the ovule and become surrounded by a tough seed coat (Freeman, 2002). A part of seed maturation and forming this tough seed coat is drying the seeds. When water leaves the seed, during the drying process, sugars interact with the hydrophilic part of the cell. This in turn stabilizes proteins before any damage can occur to the seed from drying (Freeman, 2002). Therefore there is a lot of activity and energy expended to help produce this seed and keep it alive. Also, within the petals, there lays a gland called a nectary. The nectary produces nectar, which is primarily made up of sugar (Freeman, 2002). Therefore, it is expected that the petals will have a higher concentration of sugar as opposed to the leaves of the rose. It is also assumed that the petals will have a much higher concentration of protein and starch as well, in that when a flower is cut and taken away from its root system, it goes into survival mode. Every living thing has a finite amount of energy, therefore in this survival mode, the rose must decide if they have enough energy to produce offspring, or if they must use this energy to stay alive. During this survival mode, some roses may begin to use large amounts of their energy from ATP to make defensive compounds, and use less on reproduction (Freeman 2002). On the other hand, some roses may do the complete opposite and expend all of their energy from ATP in reproduction (Freeman, 2002). Therefore, it can be determined that the healthiest rose will expend more of its energy in reproduction, therefore resulting in a higher level of carbohydrates and protein. Starch on the other hand, will exist in the petals, if at all because the rose is expending all of it’s stored energy (starch) to reproduce and stay alive. The absorption rate in the petals is predicted to be higher than the leaves, in that much of the nutrients in these roses will be going towards the petals to reproduce, therefore the nutrients will cause the photon acceptors in the petals to still work properly and absorb photons at a higher rate, therefore that part of the rose remains ‘more alive’ than leaves of the rose that are giving much of there nutrients and energy to the petals to reproduce. Another important aspect of the rose that we studied was the leaf. Leaves are very important to a rose in that this is where the primary source of energy is taken in and made into useful nutrients, such as glucose (Freeman, 2002). Photosynthesis takes place in the leaves, due to the amount of chloroplasts that are located in the leaves of the rose. Chloroplasts absorb energy in the form of red and blue photons, and reflect green photons, causing the green color in the leaves (Freeman, 2002). Since photosynthesis requires protein to take place, it is predicted that there will be some amount of protein located in the leaves, however, since the rose is going into survival mode, the healthiest rose will be expending the most energy into reproduction inside the petals. Therefore, the healthiest rose will not contain a high amount of protein inside of the leaves. It is also known that photosynthesis takes photons of light and produces those into glucose molecules that provide energy to the rose. Since the healthiest rose is using its energy not only to stay alive, but also for reproduction, it can be assumed that the healthiest rose will have higher amounts of sugar in the petals and not in the leaves. Starch is ultimately made up of sugar molecules that are stored inside the flower, therefore it is predicted that there will be little to no starch located in the leaves, in that the leaves are sending all of their stored energy to the petals in order to reproduce. It is also expected that the absorption will not be as high in the leaves because the chlorophyll will slowly degrade, due to lower amounts of nutrients in the leaves. The degrading of chlorophyll will cause photons to not be readily accepted, therefore showing a degrading health in the leaves. We believed that the Barfoed’s, Selivanoff’s, and Bial’s tests would show a presence of carbohydrates in the petal and leave extract. When testing the petals and leaves of the roses from the solutions, we found carbohydrates present in each of the petals and leaves from the roses. Carbohydrates were expected to be the highest in the petals of the roses. This is due to carbohydrates being stored in the petals as energy to reproduce in the ‘survival mode’. Barfoed’s test indicated a presence of monosaccharide in the petal extracts and no reaction on any of the leaf extract solutions, indicating a presence of disaccharides or polysaccharides in the rose leaves. This could be due to the leaves sending sucrose and glucose from photosynthesis, to the petals to store for reproduction and energy use later, thus limiting the amount contained in the leaves. When the petal extracts underwent Selivanoff’s test, the extracts from all solutions showed an immediate reaction, turning the solutions to a deep red color. After comparing our petal samples to the control, glucose, it was determined that the petals from the 7-Up rose had the darkest and most similar color when compared to the control. Therefore, it was determined that the petals from the 7-Up packet contained more ketoses and possibly more sugar than the petals from the roses in other solutions. This then supported our hypothesis in stating that this rose was providing more energy for reproduction, therefore showing that they were the healthiest. These roses were considered the healthiest in that the other roses were expending more of their sugar energy into staying alive, rather than reproduction, therefore limiting the amount of sugar found in the petals. Therefore, when comparing this data to the Selivanoff’s test that was performed on the leaves, it was shown that all of the leaf extracts had a slight reaction, indicating a presence of ketoses as well. It was predicted that the 7-Up leaves would have the smallest reaction in that it was giving much of it’s carbohydrates to the petals for reproduction. Our hypothesis was not supported and it was also concluded that the 7-Up leaves from the roses had the biggest reaction, therefore showing possibly a higher level of ketoses, which could be because the 7-Up solution provides enough sugar for the rose to provide energy not only to staying alive, but also reproduction as well. This then leads us to our reason for quantifying the Selivanoff’s test. After quantifying Selivanoff’s test, it was shown that the highest concentration of ketoses and sugar was found in the petals. This supports our hypothesis that the petals would contain for sugar because they need to use that energy to produce offspring. However, when individually looking at the leaves and petals from specific solutions, it was found that 7-Up once again had the highest amount of sugar in both the leaves and petals. This could be a result of the amount of sucrose that is found in 7-Up. Therefore, this rose was getting more sucrose and energy from this solution, whereas the other roses did not have this provided. This caused a higher level in both the rose and leaves, showing a healthier rose. Another carbohydrate test that also supported our hypothesis of the leaves containing a higher amount of carbohydrates was Bial’s test. Bial’s test tested for the presence of furanoses. The Bial’s test performed on the petals extract showed a color change in all of the solutions, with the 7-up solution having the darkest color change. Each solution changed to a bright red, deep red or orange color. The Bial’s test on the leaf extract had no effect and all of the solutions remained unchanged, showing that there were no furanoses present, however this does not eliminate the possibility of any carbohydrates being located here. This then shows once again that there are more, or different carbohydrates located in the petals of the rose, and not the leaves. Since the greatest reaction was in the petals of the rose contained in the 7-Up, this shows the 7-Up is once again using its energy to reproduce and form offspring. However, this could also be due to the high amounts of sugar that is located in 7-Up already. An iodine test was performed next in order to determine the presence of starch in the leaves and petals of the roses. We predicted that all of the leaves and petals in all of the roses would contain little or no starch in that the stored starch would be broken down into glucose and used to maintain the life of the rose, or help reproduction. In all of our experiments performed on starch, it was determined that there was no starch present in the petals or leaves of any of the roses. This then supports our hypothesis and shows that the rose is now in ‘survival mode’ and is using its energy reserves in the flower to maintain its life. However, this also shows that the results from the carbohydrate tests, showing 7-Up had more carbohydrates in both the leaves and the petals may be correct in that the flower has not been taking in numerous amounts of sugar to transform and store in the form or starch. During the Bradford Assay, we hypothesized that the petals would have a higher protein concentration due to the production of seeds in the reproductive area of the flower. Protein and photosynthesis are highly correlated in that the protein, Rubisco, is needed for the Calvin Cycle to remove carbon from carbon dioxide in the air. The enzyme ribulose 1,5-bisphosphate carboxylase (Rubisco) catalyzes the entry of carbon dioxide into the dark reactions of photosynthesis. Therefore, it would still be expected that there would be protein located in the leaves as well. After performing the Bradford Assay, it was shown that there was indeed a higher concentration of protein in the rose petals as opposed to the leaves. The highest protein concentration was specifically found in the 7-Up rose petals. This is because the 7-Up rose may be using much of its energy to produce offspring in the form of seeds and seeds are made up of protein. Therefore, this could be a cause of why the 7-Up rose petals have the highest concentration of protein. The absorption rate in the petals is predicted to be higher than the leaves. This test would show that the photon acceptors were still readily absorbing pigments at certain wavelengths. The results of this test supported our prediction in that the rose petals did indeed absorb higher amounts of pigments at certain wavelengths. This then showed that much of the nutrients in these roses were going towards the petals to reproduce, therefore there was a higher amount of nutrients in the petals, helping to make the photon acceptors more productive and able to work properly and absorb photons at a higher rate. Therefore the photon acceptor in the petals remain ‘more alive’ than photon acceptor in the leaves of the rose that are giving much of their nutrients and energy to the petals to reproduce. It was also concluded that the 7-Up solution had the lowest absorption rate amongst all the tests. This meant that the photon acceptors in these roses were degraded more then the acceptors contained in the rest of the roses, therefore resulting in the least amount of photosynthetic pigments absorbed. The R. multiflora contained in the floral packet had the highest amount of pigments being absorbed. This is very interesting in that the 7-Up shows the most nutrients going to the petals and leaves, providing more energy for these areas of the rose, whereas the floral packet does not provide as much energy to these areas, but has a higher amount of photons being absorbed. It is possible that the 7-Up solution provides sugar in the petal that acts as a preserving agent to make the rose look healthier. It is also possible that this data may have been inaccurate due to mistakes in the lab technique; there is no explanation known to us as to why this could have happened. A pH test was also performed on the leaves, petals, and solutions the roses were contained in. These results were inconclusive. We were not able to find any noticeable results that would relate to the healthiness of the rose, petals, or leaves. This could possibly be because all of the solutions were made of the same solvent. After completing these various tests, it was found that the 7-Up was ultimately the healthiest rose, experimentally and cosmetically. However, there were many different ways in which this experiment could have been done inaccurately, or have caused a bias in our results. Each week, our roses had to be placed in different areas in the room, which ultimately could have affected the overall healthiness of the rose. This is because if roses get too hot or too cold, they can wilt and die faster. Another bias in our results could have been that some of the experiments may not have been performed accurately, according the timing that was recommended for the carbohydrate tests. Inaccuracy may have also occurred because there were many times in which we had to perform experiments on the leaves and petals on separate days. This means that the solutions were sitting in the refrigerator one day longer and may have caused different molecules to be broken down. Even after all of these biases that could have occurred, it is still shown that 7-Up promotes the healthiest rose and the rose with the longest vase life. Figures Written by Jason Jaekel
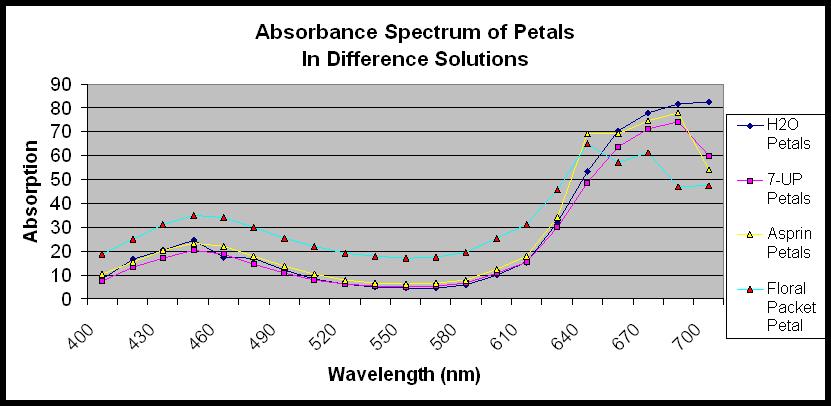
Figure 13. Shows the presence of photosynthesis absorption in R. multiflora petals. These lines show the average photosynthesis absorption present in three trials performed on the petals four R. multiflora after sitting in different solution.
|
 |
 |