Results
Lauren Beach, Katlin Daugherty, and Brian Farber
In the first independent lab, we performed five tests to show the sugar content of apples and pears. In Benedict's we saw a precipitate form in both the apple and pear
solutions. In Barfoed's the solutions became much darker in the given time for both solutions. In Selivanoff's test both of the solutions turned a dark purple in under 30
seconds, in the Bial's test both of the solutions turned a dark brown, and in the Iodine test no change occurred for both solutions (Table 1).
Table 1: The sugar content of the two fruits was tested. The observations of all three trials of each of the five tests performed are shown.
The tests were performed on the slurry solutions that were made out of the fruits.
|
Benedicts |
Barfoeds |
Selivanoffs |
Bials |
Iodine |
Apple 1 |
Turned a darker Yellow |
A strong color change occurred |
Turned a dark purple in <30 s |
Turned Dark brown |
No reaction occurred |
Apple 2 |
Turned a darker Yellow |
A strong color change occurred |
Turned a dark purple in <30 s |
Turned Dark brown |
No reaction occurred |
Apple 3 |
Turned a darker Yellow |
A strong color change occurred |
Turned a dark purple in <30 s |
Turned Dark brown |
No reaction occurred |
Pear 1 |
Turned a darker Yellow/brown |
A strong color change occurred |
Turned a dark purple in <30 s |
Turned Dark brown |
No reaction occurred |
Pear 2 |
Turned a darker Yellow/brown |
A strong color change occurred |
Turned a dark purple in <30 s |
Turned Dark brown |
No reaction occurred |
Pear 3 |
Turned a darker Yellow/brown |
A strong color change occurred |
Turned a dark purple in <30 s |
Turned Dark brown |
No reaction occurred |
Negative control
(H 2 O for all) |
No reaction occurred |
No reaction occurred |
No reaction occurred |
No reaction occurred |
No reaction occurred |
Positive control 1 |
(Glucose)
Red precipitate formed |
(Glucose)
A strong color change occurred |
(Fructose)
Dark purple |
(Fructose)
Bluish green |
(Starch)
Blackish color |
Positive control 2 |
None |
None |
None |
(Xylose)
Dark olive color |
None |
The glucose test using a CVS/Pharmacy Complete Blood Glucose Monitor showed that the apples contained an average of 505.5 mg/dL of glucose and pears contained
and average of 464 mg/dL of glucose (Table 2).
Table 2: The results of the glucose meter test. A CVS/Pharmacy Complete Blood Glucose Monitor was used to test the glucose content of both the apples and pears.
|
Test # 1 |
Test # 2 |
Apple |
511 mg/dL |
500 mg/dL |
Pear |
485 mg/dL |
443 mg/dL |
We catalogued the various photosynthetic pigments present in apple and pear leaves in our second independent lab, as well as their absorbance and action spectra. The
paper chromatography test determined the Rf values to be an average of .55 for Xanthophyll in apples and .29 for Chrlorophyll A in apples and an average of .55 for
Xanthophyll in pears and .27 for Chrlorophyll A in pears (Table 3 and Figure 1).
Table 3: The paper chromatography test results for apple and pear leaves.
|
Carotene
(Orange/yellow) |
Xanthophyll
(Pale yellow) |
Chlorophyll A
(Blue/green) |
Chlorophyll B
(Pale green) |
Total |
Apple 1 |
None |
5.5 cm |
3.5 cm |
None |
10.5 cm |
Rf |
- |
.52 |
.33 |
- |
- |
Apple 2 |
None |
6.0 cm |
2.75 cm |
None |
11.25 cm |
Rf |
- |
.53 |
.24 |
- |
- |
Apple 3 |
None |
6.25 cm |
3.25 cm |
None |
10.5 cm |
Rf |
- |
.60 |
.31 |
- |
- |
Pear 1 |
None |
6.0 cm |
3.0 cm |
None |
12.0 cm |
Rf |
- |
.50 |
.25 |
- |
- |
Pear 2 |
None |
6.0 cm |
2.5 cm |
None |
10.0 cm |
Rf |
- |
.60 |
.25 |
- |
- |
Pear 3 |
None |
6.0 cm |
3.5 cm |
None |
11.0 cm |
Rf |
- |
.55 |
.32 |
- |
- |
Figure 1: A picture of the paper chromatography test for apples and pears. The test was performed on the solutions made from the leaves of the apple and pear trees. Three trials were done to verify accurate results.
Our absorption spectrum results for our independent research shows that apples and pears both have peaks and valleys in the same places. Apple absorption spectra,
however, remain consistently lower than pear absorption spectra (Figure 2). Also results for the first week of Lab 2 when we performed these same tests on spinach
leaves, our positive control (Figure 3).
Figure 2: Graph of the absorption spectrum for the analysis of apples and pears. Two dilutions of each apple and pear leaves were tested for their absorbance at wavelengths of 400 nm to 700 nm every 15 nm.

Figure 3: Graph of the absorption spectrum for the analysis of spinach, our positive control. Two dilutions of the spinach was tested for their absorbance at wavelengths of 400 nm to 700 nm every 15 nm.
The results for our action spectrum, or Hill reactions, unlike the results for our other independent experiments show different patterns in apples and pears. The results
showed Apples to absorb white light, red light, no light, then blue light; and pears to absorb blue light, red light, white light, then no light (Table 4).
Table 4: The hill reaction determined by the action spectrum for apple and pear leaves.
|
Absorbance at 600 nm for Apple |
Absorbance at 600 nm for Pear |
White light |
1.970 |
1.418 |
Blue light |
2.420 |
1.316 |
Red light |
2.110 |
1.346 |
No light |
2.300 |
1.470 |
During our third lab, we tested for the presence of PPO and then performed various experiments to see the effects that heat and inhibitors, pH, and protein levels have on
enzymatic activity. We found in our independent lab that both apples and pears contain PPO. Also the different pHs for the apples and pears were observed (Tables 5).
The fruits with .1% catechol solution on them appear darker (Figure 4).
Table 5: The observations made during the testing of pH and presence of PPO for apples and pears.
|
Apple |
Pear |
pH |
3.0 |
7.0 |
Water Observations |
No change |
No change |
.1% catechol Observations |
Turned brown slightly where drop was applied |
Turned brown slightly where drop was applied |
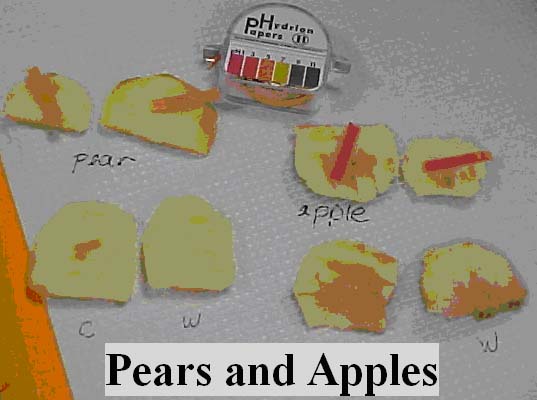
Figure 4: A Picture of the Pears and Apples Respectively During the pH and PPO Tests. Two slices of both fruits were cut and a pH strip was placed one each to test the pH. Two more slices were cut and a drop of 0.1% catecol solution was placed on one of the two piece the changes were observed.
We also found in Lab 3 that pH levels affect on the absorption of pear and apple solutions are roughly the same. The graphs of the absorption spectra for the two fruits
follow the same basic pattern. Both the apple and the pear solutions in the pH test turned colors (Figure 5 and 6).
Figure 5: A graph of the effects of pH on apples and pears. The apple and pear solutions were added to different pH buffers and the results of the absorbance was recorded.
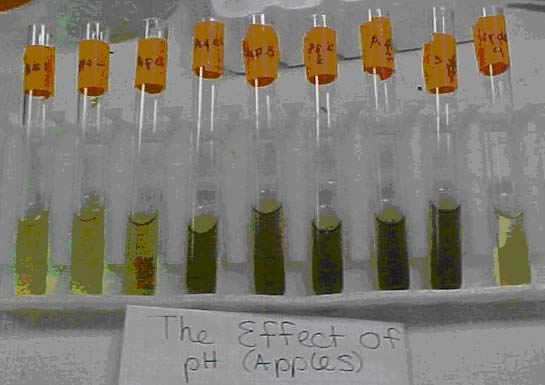
Figure 6: A Picture of the Effects of pH on the PPO enzyme in apples. For this test the apple slurry solution was added to different pH buffers and the results of the absorbance was recorded. The appearance of the solutions is shown above.
In the tests of the effects of heat and inhibitors our control for the apples and the pears turned a slight brown color adding copper ions to the boiled solution turned the
apple and pear solutions clear. Adding phenylthiourea to a test tube also turned the two fruit solutions a powdery white (Table 6).
Table 6: The effect of heat and inhibitors on the apple and pear slurries.
|
Control |
Boiled |
Phenylthiourea |
Apple |
Turned slightly brown |
Stayed clear |
Turned a powdery white |
Pear |
Turned slightly brown |
Stayed clear |
Turned a powdery white |
Lastly in our independent experiments, we found, after performing Bradford Assays, that apples have an average of .1620 µ g/ µL of protein and pears have an average
of .2465 µ g/ µL of protein (Table 7). We used our Bradford Assay results we collected for BSA in Lab 3 to construct the Bradford Assay standard curve (Figure 8).
Figure 8: The graph of Bradford assay standard curve for BSA. The Bradford assay was performed on different concentrations of a solution of BSA. The absorbance was measure to produce a standard curve.
Table 7: The observed and calculated result of the Bradford Assay for the apples and pears using the standard curve above.
( µ L) Of Solution |
ddH2O ( µ L) |
Apple
A595 |
Protein
( µ g/ µ L)
|
Pear
A595 |
Protein
( µ g/ µ L)
|
10 |
40 |
0.121 |
.3701 |
0.103 |
.2684 |
25 |
25 |
0.036 |
-.0441 |
0.167 |
.2520 |
45 |
5 |
0.183 |
.1601 |
0.230 |
.2191 |
Average |
- |
- |
.1620 |
- |
.2465 |
<< < > >>