The nutritional differences between the milks are related to the diversity of their sources, plant and animal. Previous studies have found that soymilk is an adequate cow’s milks substitute because it has a similar amount of proteins and similar sugars. Also soy protein has been shown to have certain health benefits. For children and infants who are allergic to cow’s milk or their mother’s milk often soy is an acceptable alternative; this is very important to their health. The protein content was expected to be similar among the 2% milks and the soymilk; the rice milk was expected to be less. It was expected that all the milks would have similar sugar content. It was expected that the 2% milks and the soymilk would have similar amino acids than the rice milk. The lipid test would show that the 2% milks have similar lipid content and that soymilk and rice milk would have less.
The Bradford Assay showed that the two percent milks and soymilk all contained about the same amount of protein, whereas rice milk contained less than half of the amount of protein compared to the others. The two percent white milk contained 2.680 mg protein/mL milk, the two percent chocolate milk contained 2.630mg/mL, the soymilk contained 2.720mg/mL and rice milk contained 0.943mg/mL. Using Barfoed’s test, it was found that all four milks contained polysaccharides. From Selivanoff’s test, it was found that two percent white milk contained aldoses, while two percent chocolate milk, soymilk, and rice milk all contained ketoses. The TLC test was inconclusive except that it showed that the soymilk, 2% milk, and rice milk had three amino acids in common: Pro, Val, and Try. The chocolate milk sample did not produce good data. The Lipid test showed that all the samples contained lipid.
The results supported
the
hypotheses for Bradford Assay and Barfoed’s test. The
The two carbohydrate tests used, Barfoed’s test and Selivanoff’s test, distinguished between polysaccharides and monosaccharides, and aldoses and ketoses respectively. These tests were clear in their results and were simple to execute. The results supported the hypotheses for Barfoed’s test. Selivanoff’s test also supported the hypothesis except for the 2% white milk. This could be because the white milk is the only milk without added sugars (Giampietro, 1998). Previous research has found that with added sugars (commercial) soymilk and cow’s milk do not differ greatly in carbohydrate content (Giampietro, 1998). Also it was found that milks such as rice milk that are high in carbohydrate content but low in protein content are not good substitutes for regular milk (Giampietro, 1998). Soymilk was historically used as a good nutritional source of carbohydrates and protein for peasants. It contains a balance of carbohydrates and protein similar to milk (Anonymous, Unknown).
The
The results for the TLC amino acid test were inconclusive because the amino acid fronts were hard to discern and for the chocolate milk sample only one amino acid front developed. The first time the experiment was run the milks were diluted to a 1/40 ratio in order to achieve a transmittance above 10%. However it was apparent that the dilution was too high because none of the amino acid fronts developed and the strips were blank. The second time the experiment was performed both a 1/20 and a 1/40 dilution was used for each sample. The 1/20 dilution strips developed faint amino acid fronts while the 1/40 samples did not. The amino acid fronts on the 1/20 strips were then measured and the Rf values were calculated. When the experimental Rf values were compared to the known Rf values to determine which amino acids were detected many of the experimental Rf values did not correlated with a known Rf value. Previous research found that the protein and carbohydrate amount is similar between soymilk and cow’s milk, but that the proteins supplied are different (Giampietro, 1998). Thus the amino acids are similar in amount but because they are from different sources their amino acids will be different (Giampietro, 1998). The data obtained was inconclusive and did not show this to be true.
The
lipid test showed that all the samples contained lipids. It was
expected that only the cow’s milk samples would test positive for
lipids
because the amounts contained in the soymilk and rice milk were
expected to be
trace amounts. The research indicated that soymilk and cow’s milk
contain
different lipids and thus have different affects on the body (Bertolami, 2004).
Each test performed
had some degree
of human error affecting the results. For the carbohydrate tests there
were
minimal problems and the results were reliable. However it is possible
that
there were pipetting errors. In the
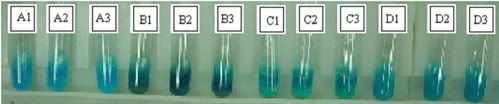
Figure 1.1. The four milks after the completion of Barfoed’s test. Barfoed’s solution was added to all of the samples of milk, and they were then heated and observed. No color change was noted, meaning that the milks contain no monosaccharides.
2% White Milk (A 1:3), 2% Chocolate Milk (B 1:3), Soy Milk (C 1:3), Rice Milk (D 1:3)
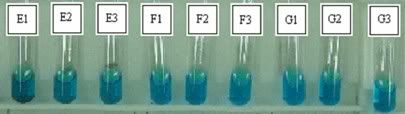
Figure 1.2. The controls after the completion of Barfoed’s test. These samples were prepared and tested the same way as the milk samples. Glucose, the positive control, underwent a color change, meaning that it is a monosaccharide. Sucrose and the mock, dd H2O, did not change color, indicating either polysaccharides (sucrose) or no sugars (water).
Glucose (E 1:3), Sucrose (F 1:3), Mock ddH2O (G 1:3)
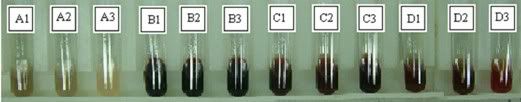
Figure 2.1. The four milks after the completion of Selivanoff’s test. For the test, Selivanoff’s solution was added to the milk samples and the tubes were then heated and observed. The 2% white milk had a weak color change, indicating that it contains a ketose. The other four milks all tested positively for aldoses.
2% White Milk (A 1:3), 2% Chocolate Milk (B1:3), Soy Milk (C 1:3), Rice Milk (D 1:3)
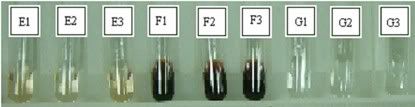
Figure 2.2. The controls after the completion of Selivanoff’s test. These were prepared in the same way that the milk samples were. Glucose, the negative control, demonstrated weak color change, confirming that it is a ketose. Fructose, the positive control, turned dark red, indicating that it is an aldose. The mock, ddH2O, did not change color at all due to its lack of carbohydrates.
Glucose (E 1:3), Fructose (F 1:3), Mock ddH2O (G 1:3)
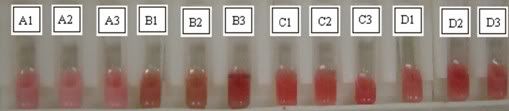
Figure 3.1. The four milks after the completion of the Lipid test. For the test, Oil Red-O was added drop-wise until a color change was apparent. The 2% White Milk, 2% Chocolate Milk, Rice Milk and Soy milk all had apparent color change, confirming that all samples contained lipids.
2% White Milk (A 1:3), 2% Chocolate Milk (B1:3), Rice Milk (C 1:3), Soy Milk (D 1:3)
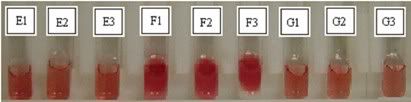
Figure 3.2. The controls after the completion of the Lipid test. These were prepared in the same way that the milk samples were. Fructose, the negative control, demonstrated no color change, confirming that it did not contain lipids. Cream, the positive control, demonstrated a color change, indicating that it does contain lipids. The mock, ddH2O, did not change color at all due its lack of lipids.
Fructose (E 1:3), Cream (F1:3), Mock ddH2O (G 1:3)
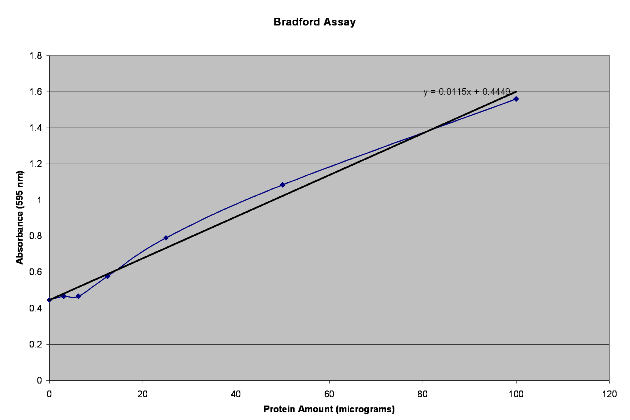